
Chapter 14. Rain, rivers and the weather people remember
The biggest flood on record on the Luckiamute River came on December 22, 1964. The flood of February 1996, the one many people remember, ranks only fifth at the gage near Suver (Figure 14.3).1 Memory and measurement each keep part of a land's weather history, and they do not always agree. This chapter shows where the measurements are kept and how to set them beside what people remember.
Rain and temperature since 1895
What it tells you. Climate is the long-run pattern: how much rain falls, how warm it gets, how long the growing season lasts. Weather history is the list of events that people remember and that left marks on the land: floods, freezes, windstorms, droughts and ice. Both help explain what grew, what failed and what fell down.2
Where to find it. All of these are free, and Chapter 25 gives the addresses.
- PRISM, from Oregon State University: estimates of rainfall and temperature for any point in the lower 48 states, by month from 1895 to the present, with 30-year averages.3
- Climate at a Glance, from the National Oceanic and Atmospheric Administration (NOAA): yearly figures for each county since 1895 (Figure 14.1).4
- NOAA Climate Data Online, and SC-ACIS from the Regional Climate Centers: the daily records and averages of single weather stations.2
- The U.S. Drought Monitor: weekly drought maps since 2000.2
How to read it. In PRISM's Explorer, click your land and download the monthly record. Note the wettest and driest years. Then find the nearest weather station with a long record and compare. Write down each station's years of record beside its average, because an average means little without the years it covers. Rainfall can change sharply over a few miles. At Dallas, on the western edge of the Willamette Valley, the average for 1971 to 2000 was about 49 inches a year.5 A 2004 assessment of the Luckiamute watershed mapped average yearly precipitation across that one river basin from Oregon State University's 103-year data. Its classes run from 40 to 45 inches at the low end to 151 to 202 inches at the high end, rising from the valley into the Coast Range.6
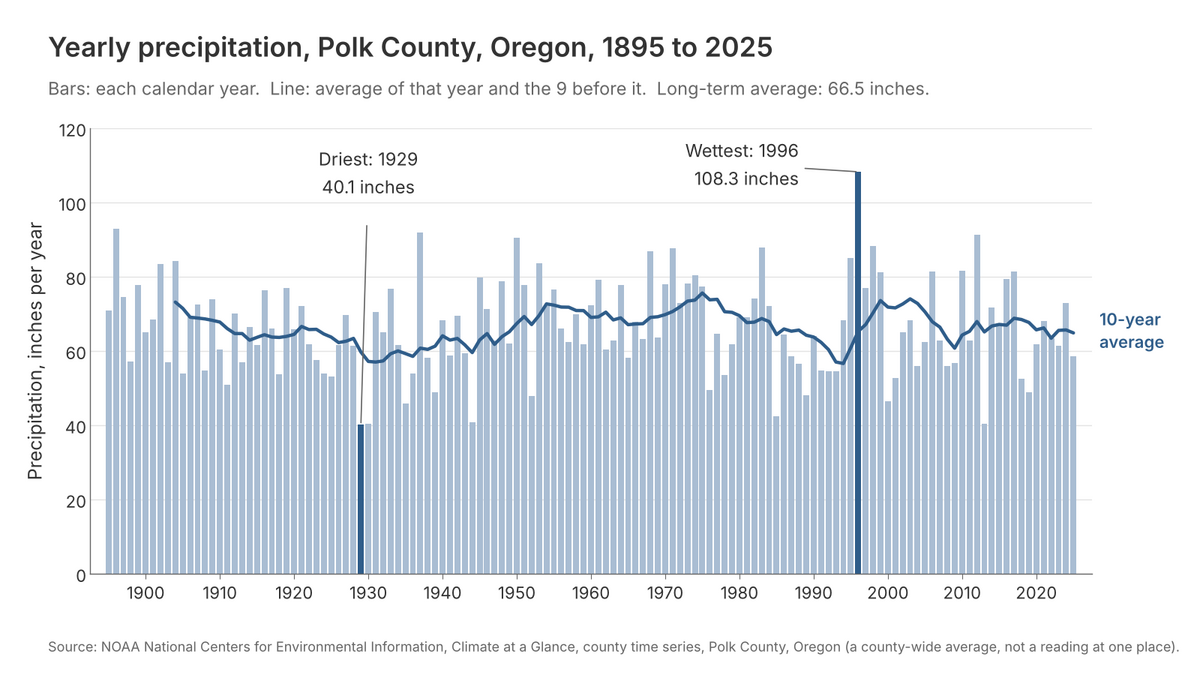
Figure 14.1. Rain in Polk County, year by year, 1895 to 2025. Find the tallest bar, 1996, at 108 inches, and the shortest, 1929, at 40. The dark line is a 10-year average, and the long-term average is 66.5 inches. These are averages for the whole county, not readings at one place. Data: NOAA National Centers for Environmental Information, Climate at a Glance, county time series, Polk County, Oregon. Chart drawn for this guide.
Storms people remember
What it tells you. A storm with a name is a fixed point. It dates the marks it left: a blowdown, a washed-out road, a stand of trees that all grew back at once. It also gives people something to remember by. The Columbus Day Storm of October 12, 1962, is one such point (Figure 14.2).7
Where to find it. NOAA's Storm Events Database lists storm reports by county from 1950. Before 1996 it lists only tornadoes, thunderstorm winds and hail, so older floods and freezes must come from newspapers (Chapter 9).2 Make a list of the big events for your county, and look each one up.
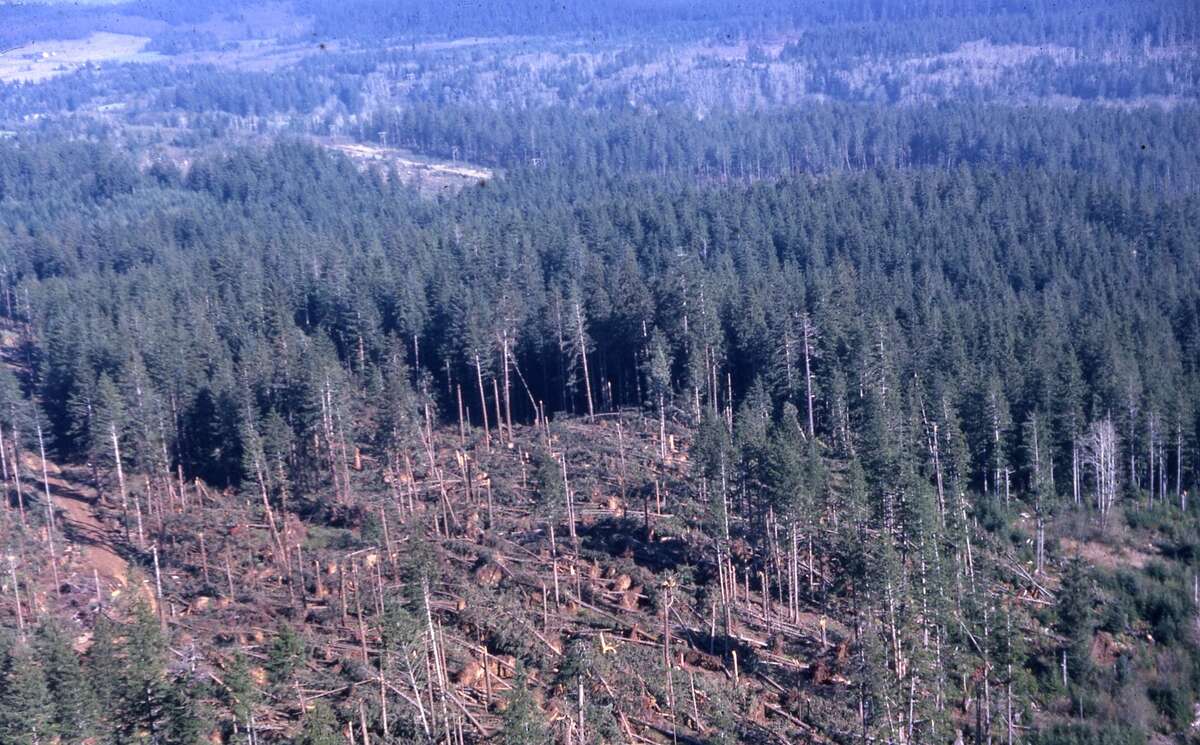
Figure 14.2. Timber blown down by the Columbus Day Storm of October 12, 1962, near Seaside, Oregon. A storm that people remember by name helps date what they tell you, and it dates the forest that grew back where the old one fell. U.S. Forest Service, Pacific Northwest Region. Public domain.
Rivers, floods and stream gages
What it tells you. Water decided where people camped, built, farmed and ran mills. A stream gage, a station that measures how much water a stream carries, can show how the stream behaved in flood and drought for a century or more. For a landowner its most useful record is the peak flow, the highest flow of each year.2
Where to find it. All of these are free.2
- USGS Water Data for the Nation: the records of the U.S. Geological Survey's stream gages, including each year's peak flow.
- USGS StreamStats: click a stream to outline the land that drains to it.
- FEMA's Flood Map Service Center: flood maps by address.
- The National Wetlands Inventory, through the Wetlands Mapper of the U.S. Fish and Wildlife Service: mapped wetlands. It is not a legal finding that a wetland is there.
How to read it. Find the gage nearest your land on the same stream and download its list of yearly peak flows. Flow is measured in cubic feet per second, the volume of water passing the gage each second. Sort the list from highest to lowest, and note the gaps: the gage near Suver kept no record from 1912 to 1940.1 Then set the list beside what people remember. If the flood everyone talks about is not the biggest in the list, ask what made it memorable: what it damaged, whom it touched, how recent it was.
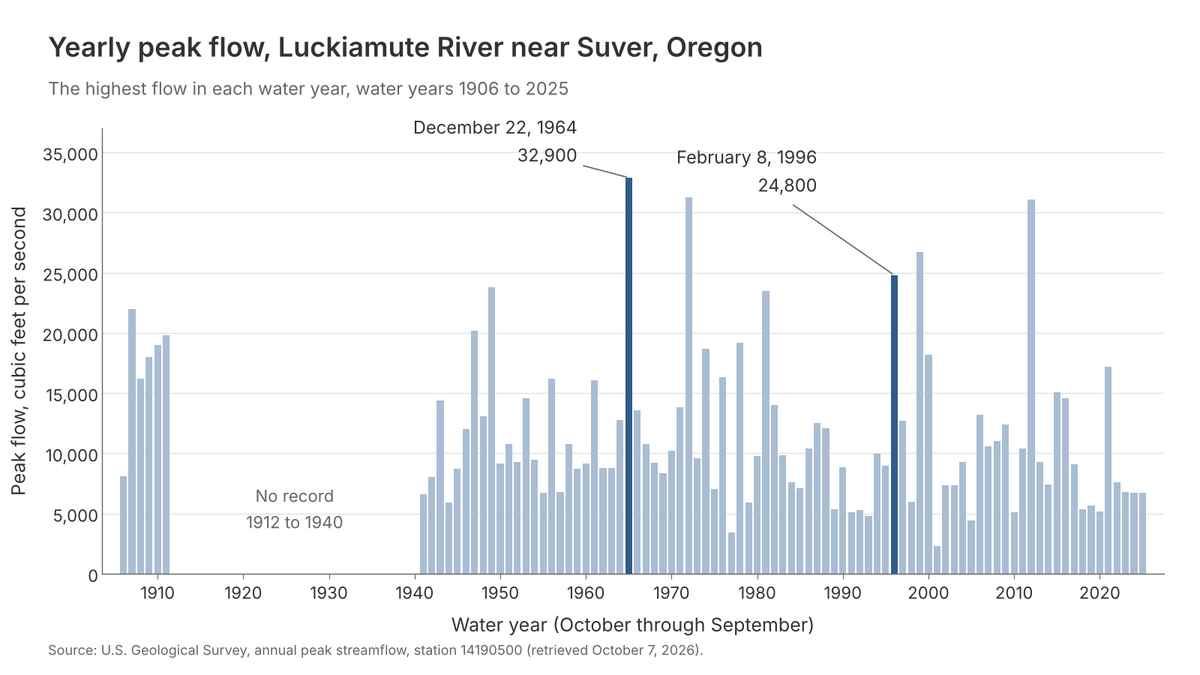
Figure 14.3. The highest flow of each year on the Luckiamute River near Suver. The tallest bar is the flood of December 22, 1964, at 32,900 cubic feet per second. The flood of February 8, 1996, at 24,800, ranks fifth. Notice the gap: no record from 1912 to 1940. Data: U.S. Geological Survey, annual peak streamflow, station 14190500, retrieved October 7, 2026. Chart drawn for this guide.
Wells and water rights
What it tells you. A well report gives the date a well was drilled, its depth, the layers the driller passed through, and the owner at the time. A water right, the state's permission to use water from a stream, spring or well for a stated purpose, shows how water was used and by whom. Cancelled rights count too, because they show uses that have stopped.8
Where to find it. In Oregon, the Water Resources Department has put scanned well reports and water right files online, free. Well reports can be searched by township, range and section, by county or by owner's name (Chapter 25).9
Logging and streams
Loggers once used the creeks themselves to move timber. A splash dam was a temporary dam that held back a creek; when loggers released the water, the flood carried their logs downstream (Figure 14.4).10 Historical records indicate that there were 80 to 100 splash dams on the Luckiamute River, with some major ones on Pedee Creek and Ritner Creek.11 That number comes from a watershed assessment written for the Luckiamute Watershed Council in 2004. Ask the watershed council for your own river whether it has one.
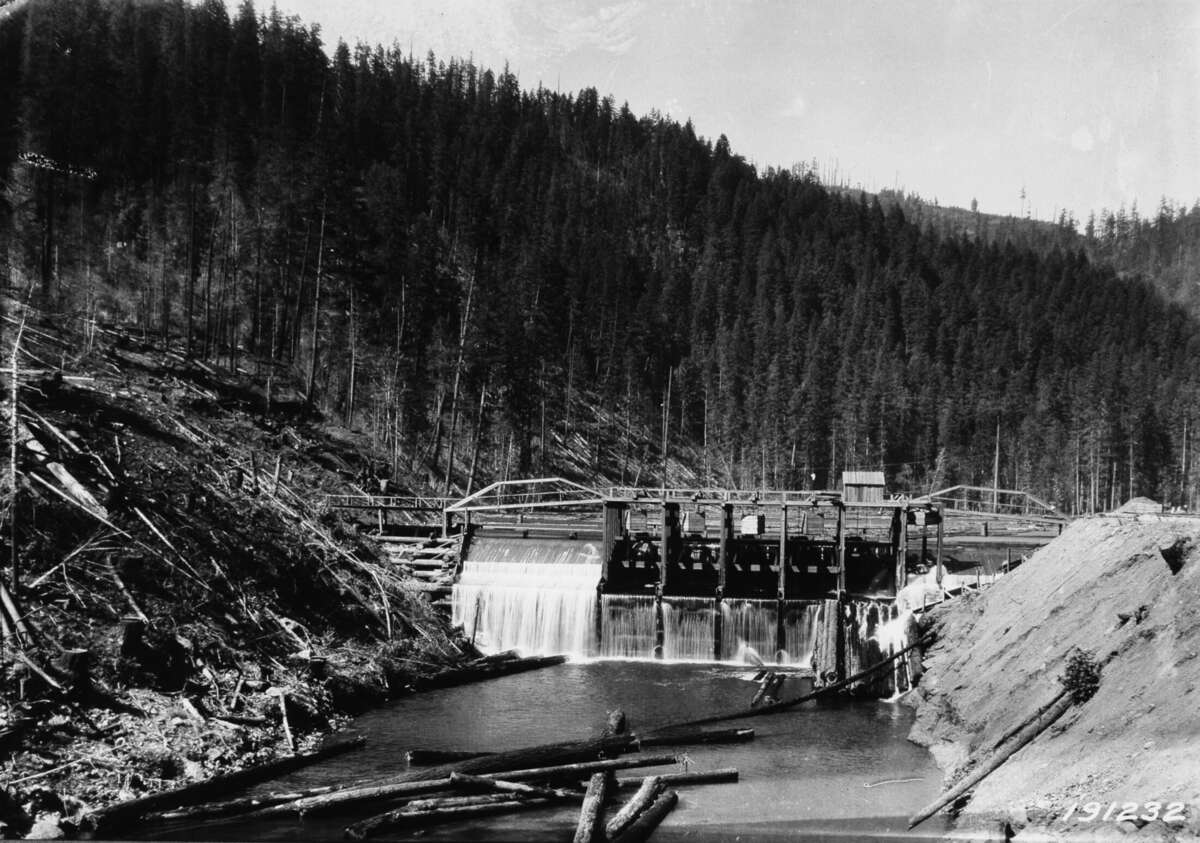
Figure 14.4. A splash dam on the North Fork Willamette River, 1924. Loggers stored water behind dams like this one and released it to carry logs downstream. U.S. Forest Service photograph by T. H. Gill. Public domain.
A caution
PRISM figures are estimates on a grid, not measurements on your land, and a county's yearly figure describes the county, not your hillside. The nearest weather station may sit at a different elevation. Small creeks rarely have gages, and the well locations in older reports are approximate.2
On the tree farm
In 1996 Polk County had its wettest year since 1895, 108 inches, against a long-term average of about 66. Its driest year was 1929, with 40.12 The farm drains west to Pedee Creek and east straight to the Luckiamute.13 A gage on the river at Pedee ran from 1940 to 1970. At both it and the gage near Suver, the highest flow on record came on December 22, 1964.1 The events a long-time resident would name include the freeze of November 1955 and the Columbus Day Storm of October 12, 1962. They also include the flood of December 1964 and the ice storm of February 2021.14 The farm's water has its own records. The 1993 survey of the main tract says that "there are water rights appurtenant to this property," meaning rights that go with the land. It gives two certificate numbers, 17385 and 40289, and lists an older easement for "access to an existing spring."15 Neither record has been looked up yet. The certificate numbers open the water rights in the state's files, and the easement is in the county deed books. And the creeks carry an older story: some of the major splash dams on the Luckiamute were on Pedee Creek.11
Notes
- U.S. Geological Survey, annual peak streamflow, station 14190500, Luckiamute River near Suver, retrieved October 7, 2026; station 14190000, Luckiamute River at Pedee; both as summarized in Zybach, B., How to Research Your Land's History, review draft, October 7, 2026, "Water: streams, springs, wells, and floods."
- Zybach, review draft, "Climate and weather history" and "Water: streams, springs, wells, and floods."
- PRISM Climate Group, Oregon State University, home page, checked October 10, 2026.
- NOAA National Centers for Environmental Information, Climate at a Glance, county time series.
- Ralph J. Garono, Becci Dale Anderson, Kirsten Harma and Christine Buhl, Luckiamute / Ash Creek / American Bottom Watershed Assessment (Earth Design Consultants, for the Luckiamute Watershed Council, June 2004), Table 2, p. 28.
- Same, Map 3, "Precipitation," drawn from the 103-Year High-Resolution Precipitation Climate Data Set for the Conterminous United States (Spatial Climate Analysis Service and Oregon Climate Service, Oregon State University, 2002); the rise into the Coast Range from the Zybach, review draft, "Climate and weather history."
- Zybach, review draft, "Climate and weather history," Figure 26.
- Zybach, review draft, "Water: streams, springs, wells, and floods."
- Oregon Water Resources Department, well report query and water rights information pages, checked October 10, 2026; Zybach, review draft, "Water: streams, springs, wells, and floods."
- Zybach, review draft, "Water: streams, springs, wells, and floods," and Figure 28.
- Garono and others (2004), p. 10, citing Licata and others (1998) and Theurer (2003).
- NOAA, Climate at a Glance, county time series, Polk County, Oregon, 1895 to 2025 (Figure 14.1).
- A History of the Land (2026), "The land today."
- Zybach, review draft, "Climate and weather history."
- Partition Plat No. 1993-0029, June 24, 1993, declaration and "Existing easements." Polk County survey CS 12769.