
Chapter 13. Rock, soil and the shape of the land
The tree farm near Pedee grows on an old sea floor. Most of the upland for 4 miles around Pedee is Tyee Formation sandstone, sand laid down on the bottom of an ancient sea about 50 million years ago.1 Today the farm's south-facing slopes are almost entirely Douglas-fir plantation.2 Between the old sea floor and the young forest lie the soil, the shape of the hills and the slides that have moved them. Each has left a record that anyone can look up.
Rock, soil and slope are the oldest part of a property's history. They decide where water runs, which soils form, where a road or a house can go, and why one slope holds while the next one slides. The maps that describe them are free.
Geologic maps
What it tells you. A geologic map names the rock under a place, gives its age and says how it formed. Geologists map rock in named units called formations, each a body of rock of one kind and age, such as the Tyee Formation.
Where to find it. In Oregon, use the Oregon Geologic Map viewer of the Oregon Department of Geology and Mineral Industries, known as DOGAMI. Click any spot to see the rock unit and the map it came from. For any state, the U.S. Geological Survey's National Geologic Map Database holds the published geologic maps. Behind the statewide maps stand older, more detailed maps of single districts. The hills on the west side of the Willamette Valley, for example, were mapped in 1954.3 Chapter 25 gives the addresses.
How to read it. Write down the rock unit, its age, and the map it came from: title, author, year and scale. A statewide map draws in broad strokes what a local map draws in detail, so keep the most detailed map that covers your land. Figure 13.1 shows the lookup for the country around Pedee.
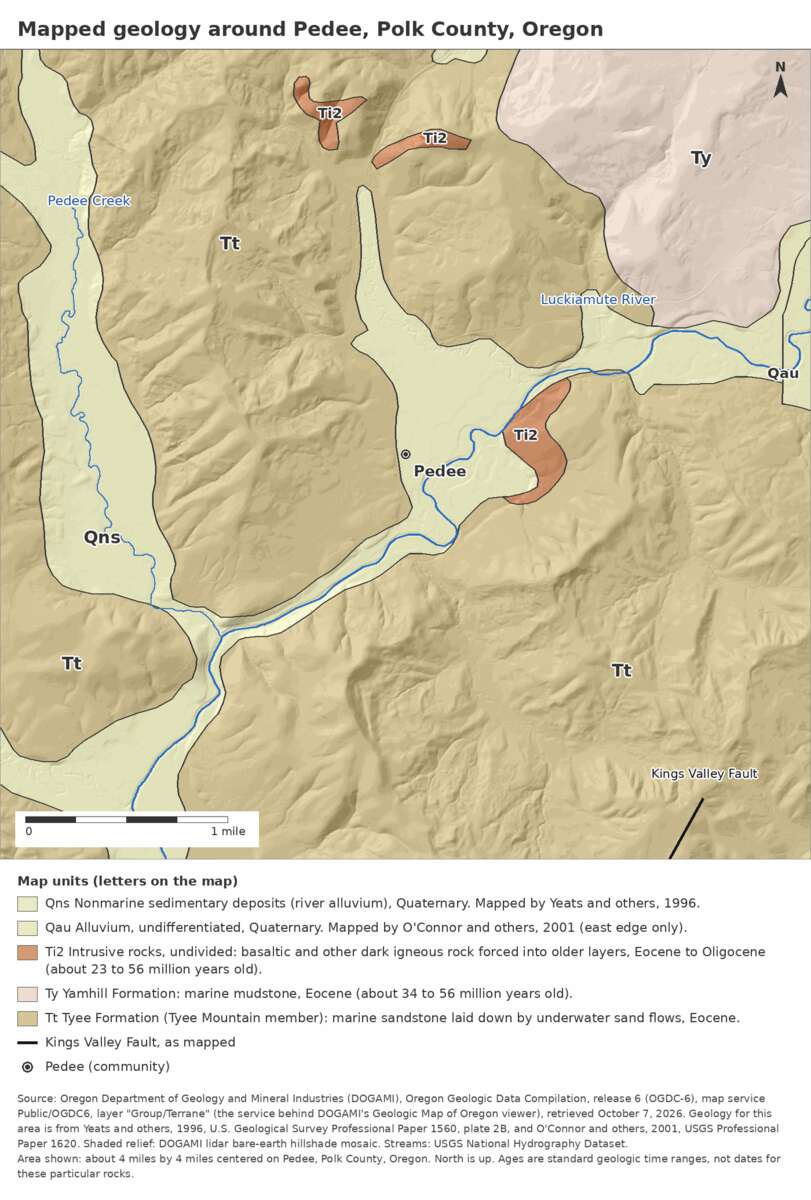
Figure 13.1. The rock under the Pedee country. Most of the upland is Tyee Formation sandstone. The flat valley floor along the Luckiamute River is river deposits. Oregon Department of Geology and Mineral Industries (DOGAMI), Oregon Geologic Data Compilation, over lidar shaded relief, about 4 miles around Pedee. Assembled for this guide, October 2026.
Lidar: the ground under the trees
What it tells you. Lidar finds what a forest hides. In the Luckiamute River gorge southwest of Pedee, a narrow, even bench shows along the river in a lidar image. In an aerial photograph of the same ground, it disappears under the trees. Older maps label a railroad grade there (Figure 13.2).4 Lidar is a laser survey flown from an aircraft. It can be drawn as bare ground, with the trees and buildings taken away, and old roads, ditches, terraces and landslides often show clearly.5
Where to find it. DOGAMI's Lidar Data Viewer covers about 99 percent of Oregon, free.5 In other states, ask the state geological survey.
How to read it. Use the shaded bare-ground view. Straight lines and level benches across a slope are usually the work of people. Write down what you see before you decide what it is. Then look for the same line on the earliest aerial photograph (Chapter 12) and on the old maps (Chapter 11).
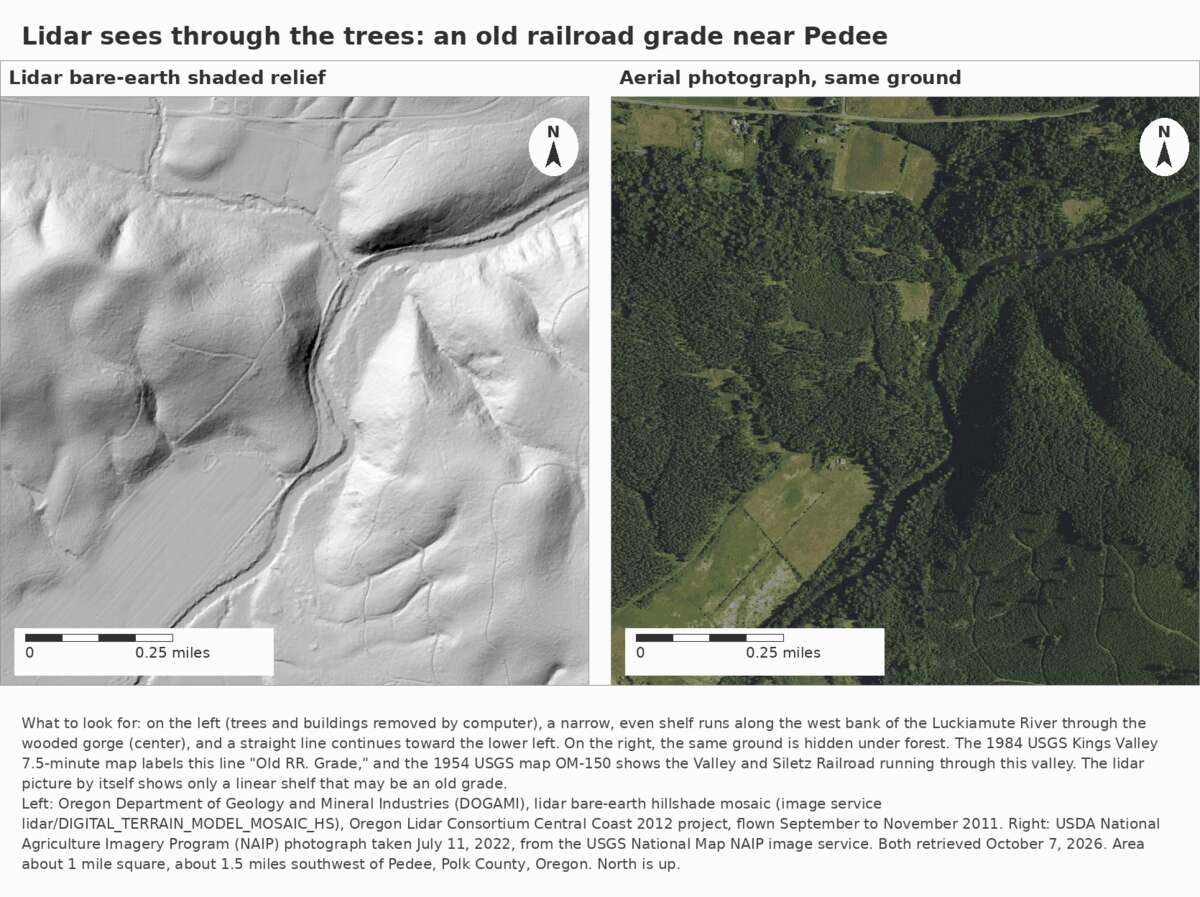
Figure 13.2. What lidar shows that a photograph hides. One square mile of the Luckiamute River gorge southwest of Pedee, in bare-ground lidar on the left and an aerial photograph on the right. Follow the narrow bench along the river on the left, then look for it under the trees on the right. Lidar: DOGAMI and the Oregon Lidar Consortium, flown in 2011. Photograph: USDA National Agriculture Imagery Program, July 11, 2022, public domain.
Soils
What it tells you. Soil keeps a record of the past. A deep prairie soil under a stand of trees suggests that the trees came later.6 Soil also decides what land can grow, how water moves through it and what can be built on it. A soil survey maps the soils of a county and describes each one: its depth, texture and drainage, and what it is suited for.
Where to find it. Web Soil Survey, from the U.S. Department of Agriculture's Natural Resources Conservation Service (NRCS), has official soil maps for more than 95 percent of the nation's counties.7 The same agency's Official Soil Series Descriptions describe each named soil in full, and SoilWeb, from the University of California, Davis, shows the maps on a phone. Many counties also have printed surveys from the early 1900s that describe the farming of their time. The Conservation Service is moving them to the Internet Archive.6 All are free (Chapter 25).
How to read it. In Web Soil Survey, draw a line around your land. The Soil Map tab lists each soil and its acres. The Soil Data Explorer gives ratings, such as how well a soil suits a road or a stand of trees. The "shopping cart," despite its name, makes a free printable report.7 Each outlined area on the map is a map unit, labeled with a symbol (Figure 13.3). Most map units are named for a soil series, a kind of soil described once and mapped wherever it is found. Read each series in the Official Soil Series Descriptions. Figure 13.4 shows one series, Jory, as a slab cut from the ground.
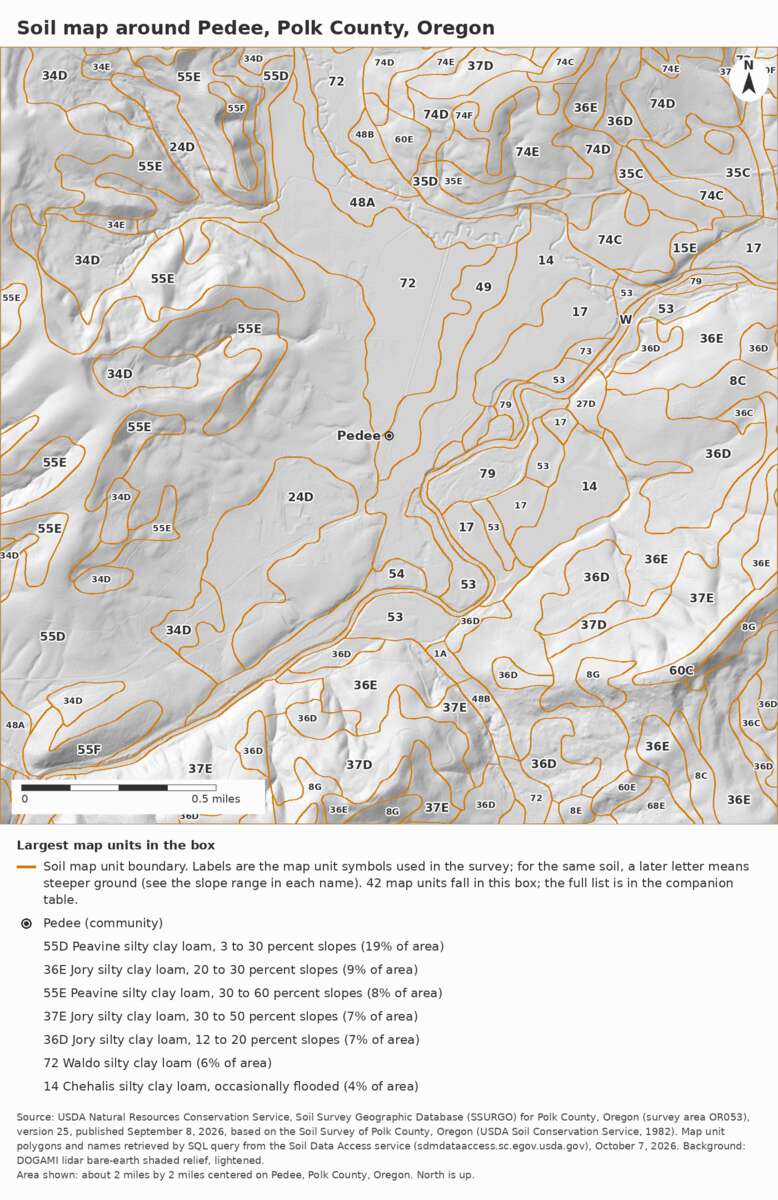
Figure 13.3. Soils for about 2 miles around Pedee. Each outlined area is one map unit, labeled with its symbol: 42 of them in this small area. Jory and Peavine soils cover more than half of it, on the uplands. Soils such as Waldo and Chehalis lie on the valley floor. USDA Natural Resources Conservation Service, soil survey of Polk County, version of September 8, 2026, drawn for this guide over lidar shaded relief. Public domain.
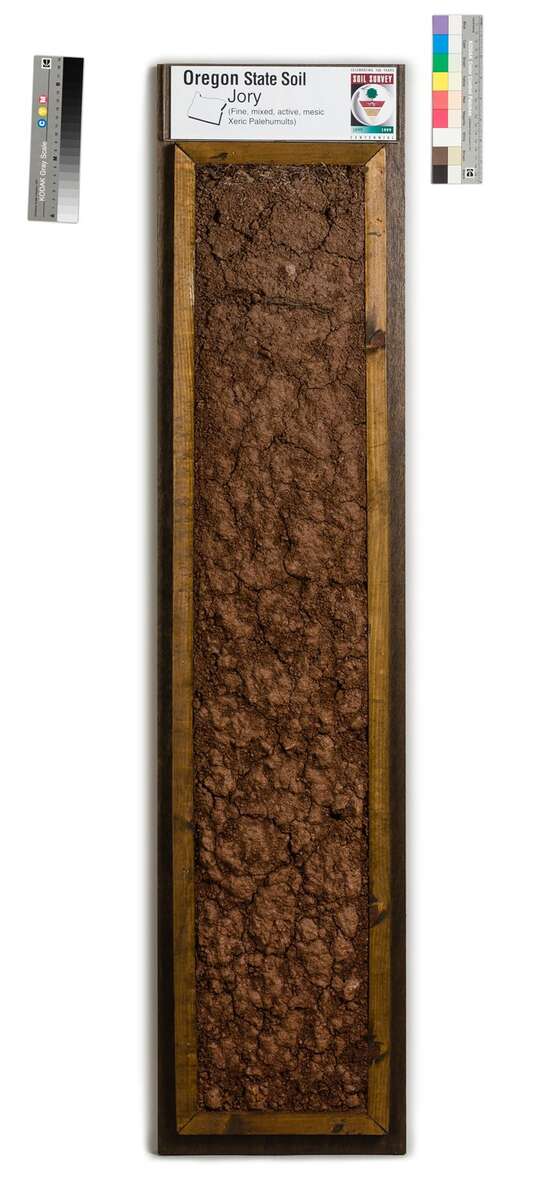
Figure 13.4. A slab of Jory soil, Oregon's state soil, prepared for a Smithsonian exhibit. The deep red clay is typical of the foothills around the Willamette Valley. USDA Natural Resources Conservation Service; photograph by Chip Clark, Smithsonian Institution. Public domain.
Landslides and other hazards
A blank space on a landslide map is not a promise. Around Pedee, almost every mapped landslide lies along the south edge of the map, where one detailed study was done (Figure 13.5).8 In Oregon, DOGAMI's HazVu viewer shows mapped hazards by address. Its landslide inventory, called SLIDO (the Statewide Landslide Information Database for Oregon), maps the slides that geologists have found, and old slides often show in lidar too. A blank map may mean only that no one has mapped that ground yet.9
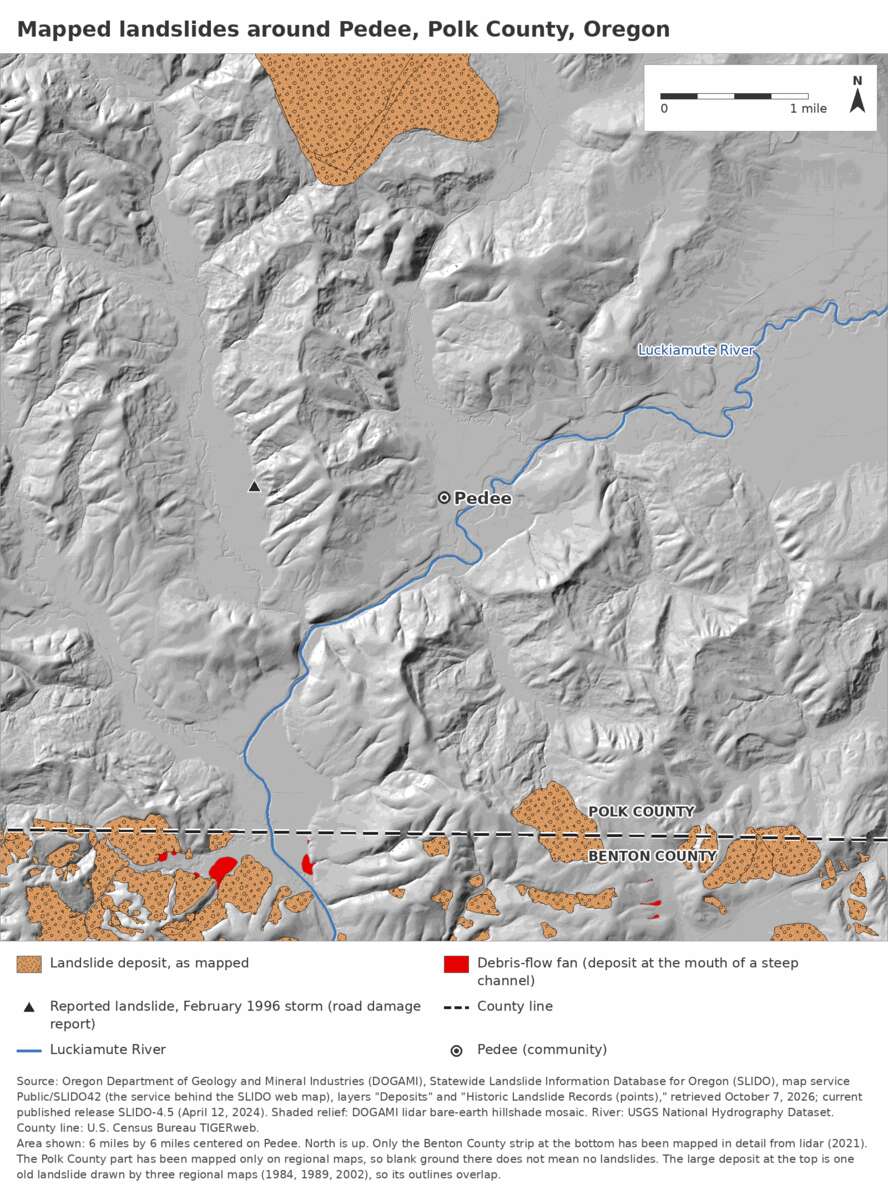
Figure 13.5. Mapped landslides for about 6 miles around Pedee. Almost all of them lie along the south edge, where one detailed study was done. The blank areas are not known to be free of slides; they have simply been studied less. DOGAMI, Statewide Landslide Information Database for Oregon (SLIDO), release 4.5, over lidar shaded relief. Assembled for this guide.
A caution
These maps were made at different times, at different levels of detail and for different purposes, and two of them can disagree at the same spot. A soil map is drawn from samples, not from a hole dug on your land, and small patches are not shown.6 None of these maps replaces a visit by a geologist or a soil scientist. None of them says whether a slope is safe to build on.
On the tree farm
The farm sits in sandstone country. Around Pedee the state's geologic map shows mostly Tyee Formation sandstone, with Yamhill Formation mudstone, small bodies of dark rock that cooled underground, and river deposits along the Luckiamute. Older rock in the region is sea-floor basalt, the Siletz River Volcanics.10 The soil map for 2 miles around Pedee, which takes in the farm, shows 42 map units. Jory and Peavine soils cover more than half of that area, on the uplands, and Waldo and Chehalis soils lie on the valley floor.11 Jory, a deep red clay of the foothills, has been Oregon's state soil since 2011.12 One step has not been taken yet: listing the map units inside the farm's own lines. It is a 10-minute lookup in Web Soil Survey, and the next thing to do.
Notes
- Oregon Department of Geology and Mineral Industries (DOGAMI), Oregon Geologic Data Compilation, read in the Oregon Geologic Map viewer for about 4 miles around Pedee, October 2026; S. Taylor, B. Dutton and P. Poston, Field Guide to the Luckiamute River Watershed (Western Oregon University, 2002).
- A History of the Land (2026), "The land today" and "December 1989 to today."
- H. E. Vokes, D. A. Myers and L. Hoover, Geology of the West-Central Border Area of the Willamette Valley, Oregon, U.S. Geological Survey Oil and Gas Investigations Map OM-150 (1954).
- DOGAMI and Oregon Lidar Consortium lidar (2011) and USDA National Agriculture Imagery Program photograph of July 11, 2022, compared for this guide; the railroad-grade label on older maps as reported in Zybach, B., How to Research Your Land's History, review draft, October 7, 2026, "Geology and landforms," Figure 22.
- Zybach, review draft, "Geology and landforms."
- Zybach, review draft, "Soils."
- USDA Natural Resources Conservation Service, Web Soil Survey, home page and "getting started" steps, checked October 10, 2026.
- DOGAMI, Statewide Landslide Information Database for Oregon (SLIDO), release 4.5, mapped for about 6 miles around Pedee for this guide.
- Zybach, review draft, "Natural hazards"; DOGAMI HazVu viewer, checked October 10, 2026.
- DOGAMI, Oregon Geologic Data Compilation (as in note 13-1); Taylor, Dutton and Poston (2002).
- Clarence A. Knezevich, Soil Survey of Polk County, Oregon (USDA Soil Conservation Service, 1982), as kept current in Web Soil Survey (version of September 8, 2026), mapped for about 2 miles around Pedee for this guide.
- Zybach, review draft, "Soils."