
Chapter 11. Maps and survey plats
On the township plat approved at Salem on May 1, 1855, the mapmaker lettered a verdict across Section 33, just west of Pedee: "Level prairie and soil 1st rate." That ground is Douglas-fir plantation today (Figure 1.2).1 The plat was drawn from Daniel Murphy's survey notes of 1854, so it is not a second witness to the prairie.2 It is the first map of the place, and most later maps of the township are drawn on the same lines.3
What it tells you
A map shows where things were in relation to each other at one time. A series of maps of the same ground, in date order, shows change.4
Kinds of maps
- Survey plats. The plat is the map drawn from the first government survey (Chapter 6). It shows section lines, streams, prairies, trails, roads, fields and houses that the surveyor noted. One plat covers one township (Figure 11.1). Claim plats show the donation land claims (Chapter 7).4
- Topographic maps. A topographic map shows the shape of the land with lines of equal elevation, along with streams, roads, railroads and buildings. The U.S. Geological Survey has published them since the 1880s.4
- County ownership maps and atlases. Maps that print the owner's name on each parcel. In the Northwest the Metsker company published them for most counties from the 1920s on. Libraries hold them; few are free online.4
- Fire insurance maps. Maps of buildings in towns (Chapter 10).
- Highway and road maps. State highway departments published county maps for decades. Oregon's are in the Oregon Digital collection and at the State Library.4
- Special maps. Geologic maps, soil maps, forest type maps and railroad maps (Chapters 13, 15 and 20).
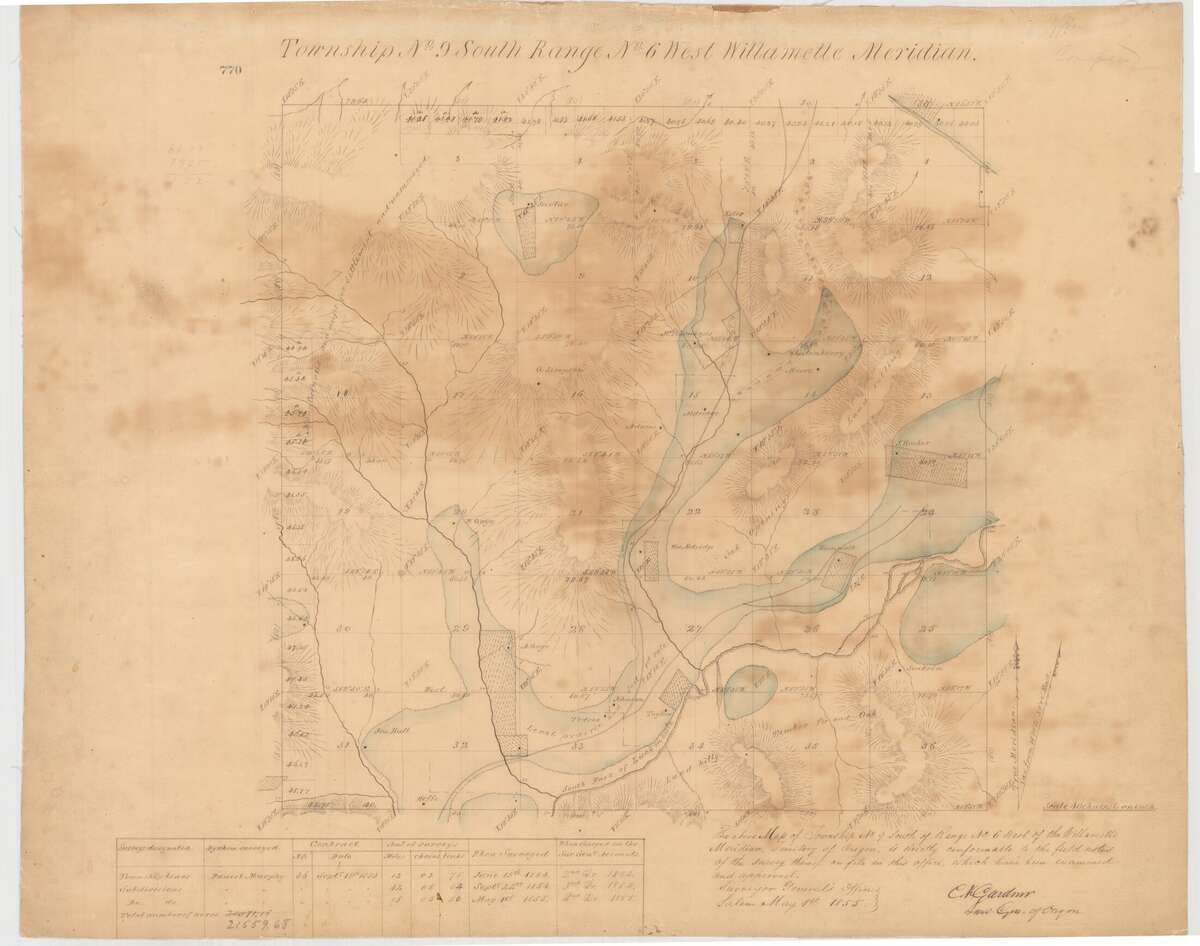
Figure 11.1. The first map of a whole township, 1855. The plat of Township 9 South, Range 6 West shows its 36 numbered sections, its streams, and the prairie and timber the surveyor crossed. Small squares mark the houses he sighted. The figures along the lines are lengths in chains, most of them close to 80, a mile. Figure 1.2 shows the part around the tree farm up close. General Land Office plat of T9S R6W, Willamette Meridian, approved at Salem May 1, 1855. Bureau of Land Management, Oregon State Office. Public domain.
Where to find them
- USGS topoView holds the Geological Survey's Historical Topographic Map Collection: more than 178,000 maps printed between 1884 and 2006, free to view and download.5
- The BLM's land records sites hold the survey plats (Chapter 6).
- The David Rumsey Map Collection is free online, with more than 150,000 maps, and Old Maps Online searches many libraries' maps by place.6
- The Library of Congress map collections, your state archives and your state university's map library hold many more.6
- The county surveyor's office keeps the surveys filed in the county and is usually glad to help the public.6
Chapter 25 gives addresses.
How to collect them
Gather every map you can find that covers your land. For each one, write down the title, the maker, the date, the scale and where you found it. Save the whole sheet, including the legend and the margins, not only the part with your land.7 The legend and the margins hold the date, the scale and the maker, and without them a map cannot be weighed.
How to read it
Check five things on every map.8
- Who made it, and why. A highway map, an ownership map and a timber map of the same square mile will each leave out what the others show.
- The date. The date printed on a map may be years later than the fieldwork behind it. Look for both. The farm's township plat was approved in May 1855, but Murphy walked its section lines in March 1854.9
- The legend. The legend is the map's key. A solid line and a dotted line mean different things, and a dotted road may be a trail, a proposed road or a guess.
- The scale. The scale tells how much ground an inch of map covers. At 1:62,500, an inch is about a mile; at 1:24,000, an inch is 2,000 feet. A map of a whole state cannot be trusted about one fence corner.
- What is left off. A building left off a map may not have existed, or the mapmaker may not have cared about it.
How to compare maps
In the 30 states surveyed on the federal grid, most maps are drawn on the same framework of township and section lines. That shared framework is what lets you line up maps made a century apart.3 Find your section on each map. Then follow one feature, such as a road, a creek crossing or a house, from the earliest map to the latest. Note when it first appears, when it moves and when it disappears (Figure 11.2).3
When you draw your own map of what you have found, keep what you observed apart from what you inferred.3 Bob Zybach and Don Ivy showed one way in Coquelle Trails (Chapter 4). Near Port Orford they lined up three maps of the same ground: an 1875 township survey map, a geological map of the 1890s and a 1941 ownership map. All three are drawn on the same survey lines. On their own maps they drew the roads and trails that still exist as solid lines. Routes that were predicted, or documented but no longer mapped, they drew as dotted lines. Then they went to look, and visited about 80 percent of the study area.10 A reader can tell at a glance which routes are on the ground today and which are reconstructions.
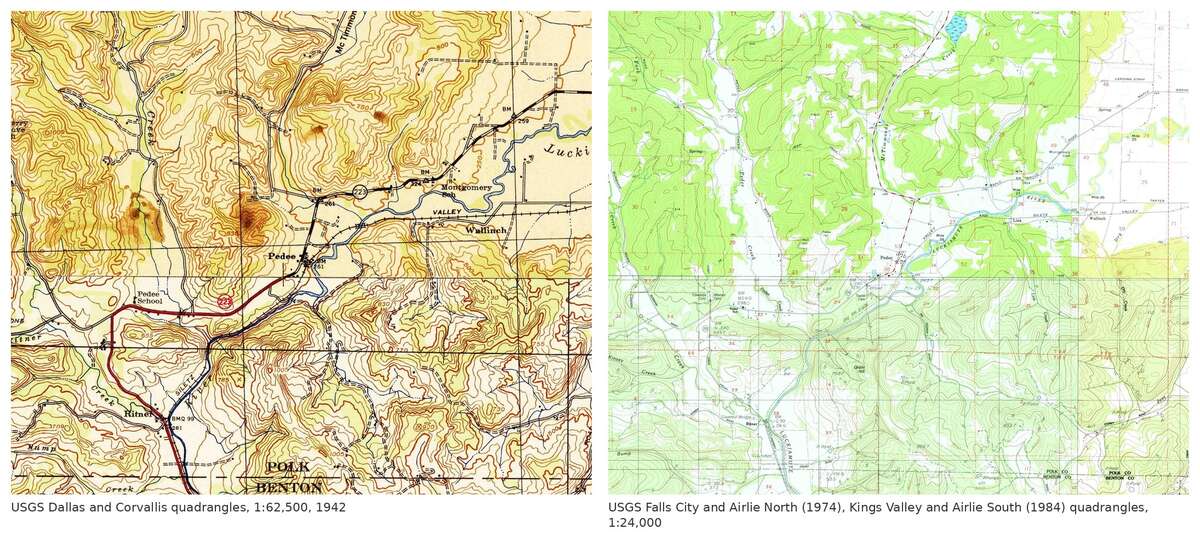
Figure 11.2. The same six by 5 miles around Pedee on topographic maps of 1942 (left) and of 1974 and 1984 (right). Follow the highway and the railroad from one map to the other, and find Pedee on both. The green tint for forest appears only on the later maps, and they are drawn at a larger scale, 1:24,000 against 1:62,500, so they show more. A change in the map is not always a change in the land. U.S. Geological Survey, Dallas and Corvallis quadrangles (1942); Falls City and Airlie North (1974) and Kings Valley and Airlie South (1984) quadrangles. From topoView. Public domain.
What it costs
Most of these maps are free to view and download. Ownership atlases are mostly on library shelves, which costs a visit.
A caution
An old map is not a boundary survey. Survey corners have been reset, roads have moved and creeks have shifted. If the question is where a line runs today, hire a licensed surveyor.11
On the tree farm
Three maps of the farm's ground, made decades apart, each tell the truth about their own year. The township plat of 1855 carries the surveyors' measurements along its lines: 79.87, 80.07 and 80.33 chains. A chain is 66 feet and 80 chains make a mile, so each line is about a mile and none is exactly one. Murphy's own figure for the line between Sections 28 and 33, which runs through the farm, is 80.07 chains (Figure 6.1).12 The Geological Survey's map of 1942 shows Pedee, the highway and the railroad, with no green tint for forest anywhere. The editions of 1974 and 1984 add the tint (Figure 11.2).13 A blank on the 1942 map is not evidence of open ground: the air photograph of 1936 shows dark tree clumps on the same land (Chapter 12).14 And today's county map layers still carry the Tedrow and Johnson claim lines that Hutchinson ran in 1855.15 The 1993 survey of the farm starts from one of their corners (Chapter 3). What no map yet found shows is where the prairie's edge ran inside the sections. The plat only repeats what Murphy saw along his lines.
Notes
- General Land Office plat of T9S R6W, Willamette Meridian, approved May 1, 1855, BLM Oregon State Office; A History of the Land (2026), "1852 to 1854: The surveyors arrive and find neighbors."
- A History of the Land (2026), "1852 to 1854."
- Zybach, B., How to Research Your Land's History, review draft, October 7, 2026, "How to compare maps."
- Zybach, review draft, "Maps and survey plats" and "Kinds of maps."
- U.S. Geological Survey, topoView, site text, checked October 10, 2026.
- Zybach, review draft, "Where to look" (maps).
- Zybach, review draft, "How to collect them" (maps).
- Zybach, review draft, "How to read a map."
- Plat of T9S R6W (1855); A History of the Land (2026), "1852 to 1854."
- Bob Zybach and Don Ivy, Coquelle Trails: Early Historical Roads and Trails of Ancestral Coquille Indian Lands, 1826-1875 (Coquille Indian Tribe, 2013), Volume I, Part 1.
- Zybach, review draft, "A caution" (maps).
- Plat of T9S R6W (1855), as read in A History of the Land (2026), "How the old surveys worked"; Murphy (1854), vol. R0029, p. 331.
- U.S. Geological Survey, Dallas and Corvallis quadrangles (1942), Falls City and Airlie North (1974), and Kings Valley and Airlie South (1984), topoView; Zybach, review draft, Figure 14.
- USDA aerial photograph of 1936, Oregon Digital, as described in A History of the Land (2026), "The twentieth century, seen from the air."
- A History of the Land (2026), "December 1989 to today," Figure 12 and its caption (Polk County map layers).