
Chapter 23. The same method in town and on the wheat plains
The George Earle Chamberlain House, in the Hackleman Historic District of Albany, was built about 1880, according to its National Register nomination.1 A house like that has a different set of records than a tree farm, and a dryland wheat field has a third. The method stays the same. What changes is which sources lead.
A house built about 1880 in Albany
Albany began as a land claim. Thomas and Walter Monteith bought Hiram Smead's claim in 1848 and laid out the town, and the Oregon and California Railroad arrived in 1871.2 A house built about 1880 went up in a river town that had been a railroad town for less than ten years.
In town, buildings, maps, owners, the census, newspapers and photographs lead. Start here (Figure 23.1):
- The National Register. Two of Albany's residential neighborhoods and its downtown were listed on the National Register of Historic Places in the early 1980s.3 A nomination is a short researched history with its sources.
- Fire insurance maps. Oregon State University's Special Collections and Archives Research Center holds Sanborn maps of Albany for 1884, 1888, 1890, 1895, 1908 and 1925, and the Library of Congress has the 1890 map free online (Chapter 10).4 Compare the outline of the house from map to map to date its additions.
- City directories, to see who lived at the address year by year.
- The deeds, at the Linn County Clerk's office (Chapter 8).
- The census pages of 1880 and 1900, for the household and its neighbors (Chapter 9).
- Albany's newspapers, in Historic Oregon Newspapers, searched by the owners' names (Chapter 25).
- The Albany Regional Museum, 136 Lyon Street SW, which takes research requests and has an online catalog of its collections.5
Two older layers still matter in town. Albany sits on the Willamette River, so its flood history is part of every house's story (Chapter 14). And the ground under it is Kalapuyan homeland, ceded by the same treaty of 1855 as the tree farm (Chapter 16).6
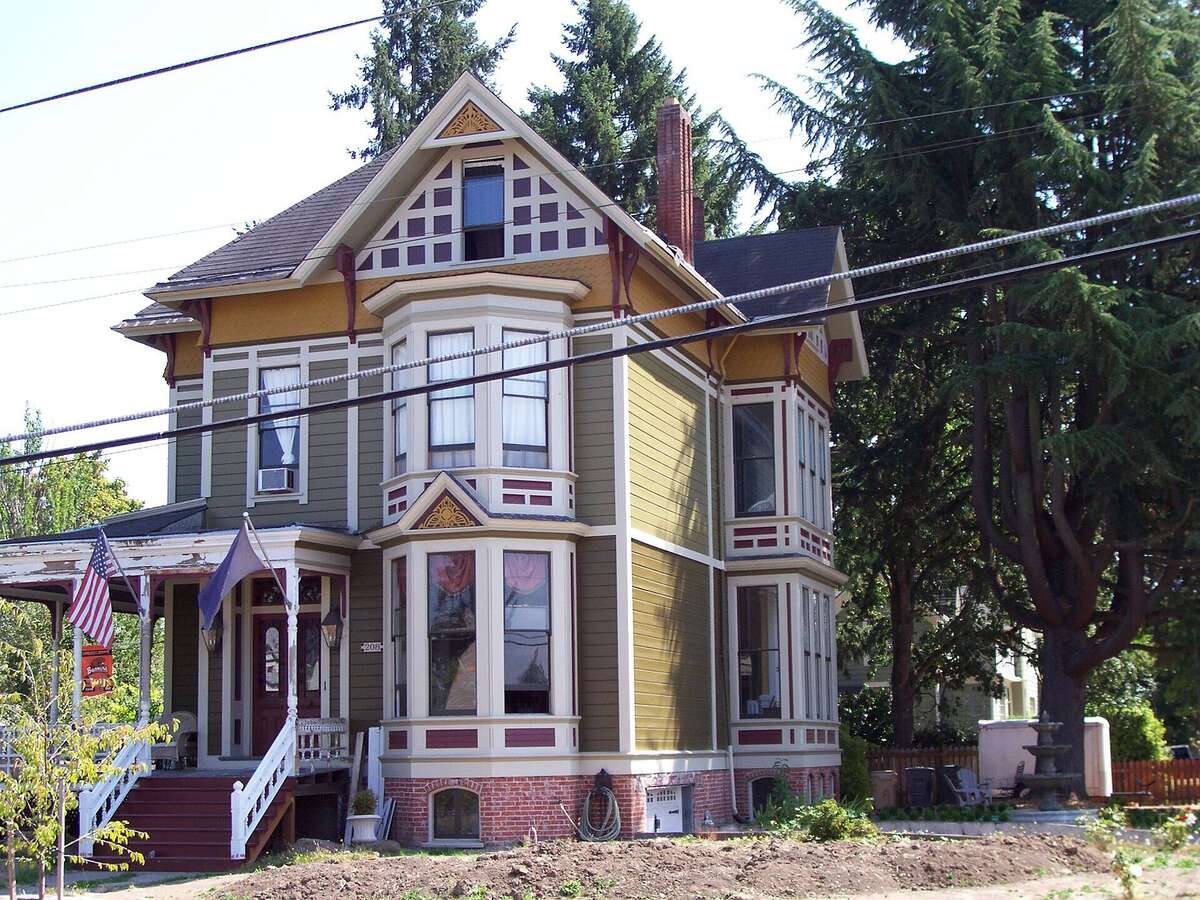
Figure 23.1. The George Earle Chamberlain House in Albany's Hackleman Historic District. Built about 1880, according to its National Register nomination. The bay windows, the decorated gables and the porch are the kind of details a house history dates, and the Sanborn maps can show when each part of the outline first appears. Photograph, 2009, Wikimedia Commons. Released to the public domain by the photographer.
A dryland wheat field near Moro
On the Columbia Plateau the soil, the rain, the first title, the crops, the railroad and the view from the air lead. At Moro, in Sherman County, precipitation averages 11.4 inches a year, and the soil at the state's research station there is Walla Walla silt loam.7 Sherman County became the state's largest producer of wheat beginning in the 1880s. The Columbia Southern Railroad built its depot at Moro in 1898, which made the town a shipping point, and in 1909 the Oregon Agricultural College set up a research station there for crops of low-rainfall country, now the Columbia Basin Agricultural Research Center.8
From the air the fields form a patchwork of two colors (Figure 23.2). Planted fields alternate with fallow, cropland left unplanted for a year so the soil can store water for the next crop. A map of the crops grown in 2025, in a 6-mile square around Moro, counts 32 percent winter wheat, 38 percent fallow or idle cropland and 21 percent grassland or pasture (Figure 23.3).9
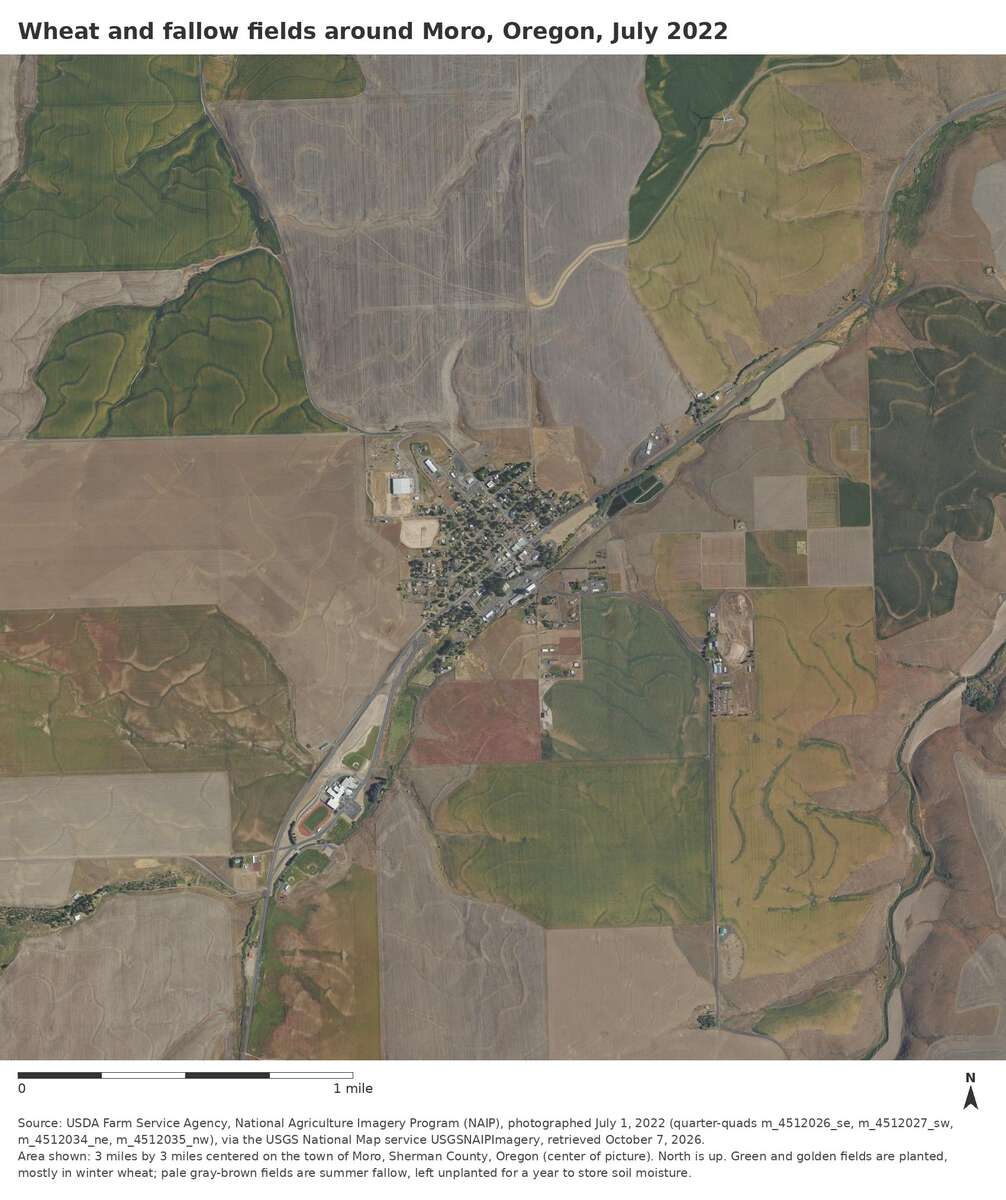
Figure 23.2. Wheat and fallow around Moro, July 1, 2022. The town is at the center of a square 3 miles on a side. Green and golden fields are planted, mostly in winter wheat; the pale gray-brown fields are fallow, left unplanted for a year. USDA National Agriculture Imagery Program, July 1, 2022. Public domain.
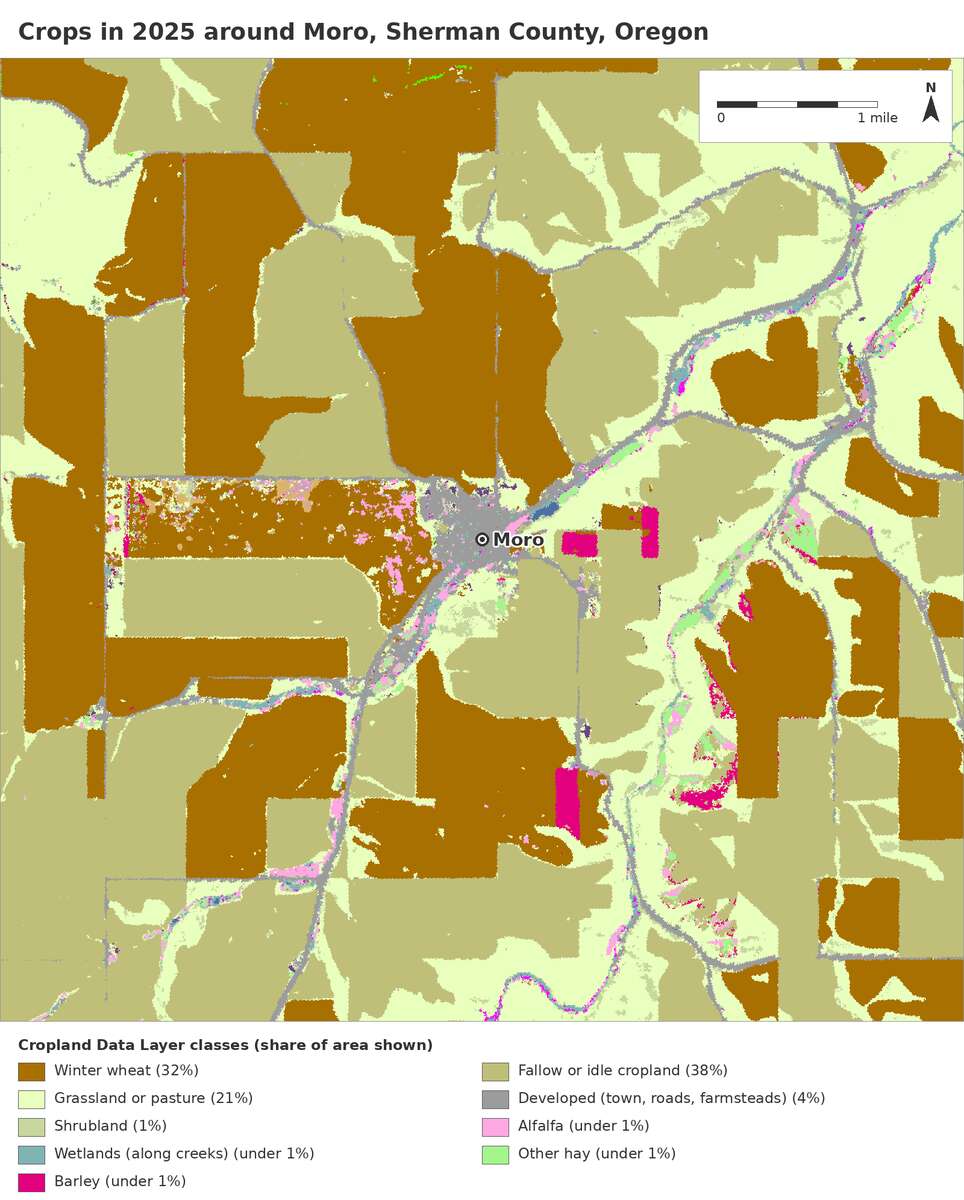
Figure 23.3. What was grown around Moro in 2025. Brown is winter wheat and olive is fallow or idle cropland; pale green is grass or pasture, most of it along the draws. The square is 6 miles on a side, with the town at its center. USDA National Agricultural Statistics Service, Cropland Data Layer, 2025, retrieved October 7, 2026. Drawn for this guide.
For a field like these, start with Web Soil Survey for the soil (Chapter 13); PRISM for rainfall, since in 11-inch country a run of dry years matters (Chapter 14); General Land Office Records, to learn whether the land was a homestead or railroad grant land (Chapter 7); the Census of Agriculture, for the county's wheat acreage decade by decade (Chapter 15); aerial photographs from the 1930s on, for field shapes and farmsteads that have vanished (Chapter 12); and the neighbors, for how the work changed from horses to tractors (Chapter 18).
On the tree farm
On the farm near Pedee the survey notes, the patents and the aerial photographs led, because settlers were living there before the surveyors came and the forest grew back within sight of the camera. In Albany the buildings and the town maps lead, and near Moro the soil, the rain and the crop records do, but the circle of Chapter 19 runs the same way in all three places.
Notes
- National Register of Historic Places, George Earle Chamberlain House, Albany, listed February 22, 1980, nomination by Theresa Larson, August 30, 1979, as summarized in "George Earle Chamberlain House (Albany, Oregon)," Wikipedia, checked October 10, 2026; Hackleman Historic District nomination, City of Albany Planning Staff, May 6, 1981.
- Mark Spence, "Albany," The Oregon Encyclopedia, last updated November 3, 2022.
- Same.
- Oregon State University Libraries, Special Collections and Archives Research Center, Sanborn Fire Insurance Maps of Oregon, 1879-1956, collection guide, Archives West, checked October 10, 2026; Library of Congress, Sanborn Maps collection, Albany, 1890.
- Albany Regional Museum, armuseum.com, checked October 10, 2026.
- Melinda Jette, "Kalapuya Treaty of 1855," The Oregon Encyclopedia, updated March 17, 2022.
- Oregon State University, Columbia Basin Agricultural Research Center, "Climate and Soils," checked October 10, 2026.
- Jenna Barganski, "Moro," The Oregon Encyclopedia, last updated April 15, 2026.
- USDA National Agricultural Statistics Service, Cropland Data Layer, 2025, shares of the 6-mile square around Moro as counted for Figure 23.3; the fallow practice as described on the source note of Figure 23.2.