
Chapter 8. Water and weather
Part 2. Reading your report.
"Water and weather" opens by saying where its numbers come from, usually a county-wide average, and then gives how much rain and snow falls in a year, in the earliest records and now.
What it says. Rain, snow and temperature; streams, springs, wells and floods when the records have them.
Where the facts come from. The National Oceanic and Atmospheric Administration's county records, which go back to 1895, and the U.S. Geological Survey for streams.
What to notice. The weather figures are averages for the whole county, not readings taken on your land. Hills and valleys in the same county can differ by many inches of rain.
If the part is folded. "The weather records we have are for the whole county," followed by the first of those county figures.
In the sample report
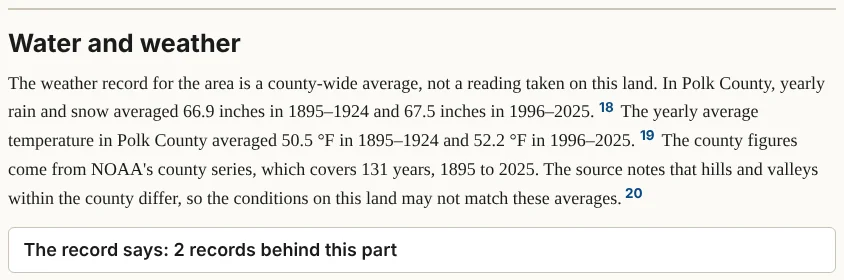
In Polk County, rain and snow averaged 66.9 inches a year from 1895 to 1924 and 67.5 inches from 1996 to 2025, nearly the same. The yearly average temperature rose from 50.5 to 52.2 degrees Fahrenheit over the same two periods.1
Notes
- NOAA National Centers for Environmental Information, Climate at a Glance, Polk County series, retrieved October 8, 2026. ↩